
Welcome
Welcome to casasmooth, your solution for a smart, reliable, and private home. casasmooth is designed to adapt to your life, automating your environment in an intuitive and secure way.
The system is modular and organized around functional packs that you can choose and combine:
-
lights: simple (standard) or advanced (enhanced) management of your lighting.
-
heating: basic temperature control (standard) or optimized by presence (enhanced).
-
security: monitoring and alerts (standard) or with complex scenarios and AI (enhanced).
-
and many others: shutters, energy, multimedia, etc., each with standard or "enhanced" (improved) levels of integration.
The home section is the heart of your system, always available. It allows you to see the status of all your devices and control them directly, room by room.
Casasmooth respects your privacy: it works without the internet and doesn't need the cloud. All your data stays securely on your computer. If you wish, a backup of your configuration can be sent to our secure services to ensure easy recovery in case of a problem.

Getting started
Setting up your casasmooth system is a simple process designed to give you control from the start.
-
Account creation: The first step is to create accounts for your household members. This allows casasmooth to personalize experiences and manage access rights.
-
Pairing devices: Adding new devices (bulbs, sensors, plugs) is done in a few steps; consult our tutorials for instructions. The most important thing is to give each device a clear name and, above all, to assign it to a zone (for example, "Sofa Lamp" in the "Living Room" zone). This assignment is essential, as it allows casasmooth to understand your home's layout and apply automations to the right place.
Tip : Specialize your simple devices. To assign specific functions to standard modules or sockets (On/Off type), rename them using the following prefixes:-
bulb_: integrates a simple lamp into the automatic lighting management logic.
-
heater_: transforms an on/off radiator into a smart thermostat (controls by presence and temperature setting). Ideal for bathrooms, offices, etc.
-
outlet_: treats the module as a socket with (virtual) consumption measurement for energy management.
- shutter_: controls the device like a simple roller shutter control.
-
fan_: uses the device to control a fan or air conditioning (e.g., in case of extreme heat).
-
dimmer_: allows a simple button to be recognized as a dimmer switch.
-
- Total flexibility: Your home's layout isn't fixed. Moving a floor lamp from the living room to the office? Simply change its zone assignment. Want to rename "Office" to "Guest Room"? It's just as easy. casasmooth is designed to adapt: after a quick update of a few seconds, all the logic and automations will apply to the new configuration.
-
Service integration: Once your devices are paired, you integrate the casasmooth services. This is when you connect your system to your account by providing your information (email, mobile number for alerts, and the base URL of your system).
-
Customization: You can adjust the appearance of your interface, including choosing a visual theme (dark or light) that suits you.
-
Remote access: To control your home remotely (via the mobile app or a web browser), casasmooth uses a secure connection (via Nabu Casa). This allows you to keep an eye on your home, arm the alarm, or adjust the heating, from anywhere in the world.
-
Artificial Intelligence (AI): casasmooth integrates advanced AI capabilities, allowing you to interact with your home via chat or directly by voice to execute commands or ask questions about the status of your home.

Structure
Casasmooth's interface is organized hierarchically to remain simple and clear:
-
dashboard: this is the entire application, accessible via the main icons (home, security, energy, etc.).
-
sections: each icon on the dashboard opens a dedicated section (e.g., the "home" section, the "security" section).
-
Panels: Each section contains panels. In "home", each zone (e.g., "kitchen", "living room") is a panel.
-
Control panels: Special panels, often hidden, allow you to adjust automations.
-
Elements: these are the individual controls: switches, sliders, graphics, text fields...
Sections and panels
Here is the complete description of all the sections and their panels.
"Home" section
The "home" section is your home page. It groups all your devices by zone and gives you access to the detailed configuration of the entire system.
Main badges
At the top of the "home" section, you will find global status icons:
-
Settings: Tapping this icon shows or hides the main "home" settings panel. This is where you adjust what is visible on your dashboard.
-
Away: This button activates or deactivates "away" mode. In "away" mode, the house adapts its automations (e.g., lowering the heating, activating certain alerts).
-
Scenario: Activates "playback" mode, which can be used to simulate presence or play recorded lighting scenes. Casasmooth records all actions throughout the day, over several days. When you activate the scenario (or playback), Casasmooth turns off all the lights and begins to execute your actions from a randomly selected day in the past few days; your habits are thus replicated and change daily.
-
"?" : takes you directly to the online documentation!
Home control panel
When you activate the "settings" badge, this panel appears. It allows you to fully customize the display of the "home" section.
-
base: this area contains useful links (help, documentation, support, FAQ) and allows you to choose the area panels (e.g., "kitchen", "living room") and general panels ("date & time", "welcome", "weather", "energy") that you want to display or hide on your home page.
-
Display: This panel controls the types of devices you see in your zones. You can choose to show or hide "thumbnails" (header images), zone "titles," category "subtitles" (such as "lights," "sensors"), and then each device category:
-
lighting: simple switches (on/off).
-
lighting+: detailed control (intensity, color) for compatible lights.
-
outlets, power outlets, scenes, automations, locks, sirens, batteries, sensors, hvac (heating/cooling), shutters (blinds), security, cameras, car, storage, kitchen (appliances), cleaning, vacuums, media, televisions, and settings (shortcuts).
-
Some of its panels also provide access to additional settings, for example:
-
The last "settings" section simplifies access to the settings of each zone and allows you to hide the zone in question if it is not needed in the usual view.
-
Vacuum cleaners: a switch allows you to tell a vacuum cleaner to stay in its "niche" when someone is in the room
-
-

-
Domains: This panel controls the visibility of advanced settings panels in each zone. If you enable "lighting" here, the lighting settings panel will appear in each zone (when you are in "settings" mode). The available domains are: "timer", "lighting", "heating", "shutters", "weather", "security", and "cameras".
General panels
-
date & time: displays the current time and date.
-
Welcome: a home panel with links to user and device settings. It also contains the essential fields to link your system to your casasmooth account:
-
Your email and phone number: required for notifications and services.
-
Casasmooth backup: button to start a manual backup.
-
casasmooth services: button to synchronize services.
-
Casasmooth update button: to update your system. It is greyed out (locked) if an update is already in progress.
-
-
Weather: Displays detailed weather forecasts for your location.
-
Energy: Displays a summary of your energy consumption and production, with a date selector and a distribution graph.

Typical area sign (example: "living room")
Each zone you have created (e.g., "kitchen", "living room", "office") is represented by a similar panel. We will use "living room" as a generic example to describe its structure.
-
Header: displays the name of the area ("living room") and a series of "badges" (small icons) showing key measurements, such as current temperature, humidity or brightness.
-
Thumbnail: if enabled (via "display"), an image or live camera feed of the area is displayed.
-
Lighting: a grid of tiles for each light in the "living room".
-
Action: Pressing the button turns the light on or off.
-
Display: If "lights+" is enabled in the "display" settings, compatible lights will display a slider to adjust the intensity (and sometimes the color). Otherwise, it's a simple on/off switch.
-
-
scenes: this panel allows you to create and recall lighting atmospheres.
-
playback bar (default):
-
Robot icon: activates or deactivates lighting automations (e.g., motion-activated lighting) for the "living room".
-
1, 2, 3, 4: buttons to instantly recall scenes 1, 2, 3 or 4.
-
Up arrow: displays the recording bar.
-
-
recording bar (after pressing the arrow):
-
100%: button to turn on all the lights in the "living room" at 100%.
-
save 1, 2, 3, 4: after setting your lights as you like, press one of these buttons to save the current state as a scene.
-
Down arrow: hides the recording bar and returns to the playback bar.
-
-


-
automations: shortcuts for automations.
-
robot icon: identical to the "robot" button in scenes, it activates/deactivates lighting automations.
-
buttons to quickly adjust all the lights in the area to 100% or according to the current configuration (scenes, colors, lighting power)
-
Sun icon: activates the circadian lighting system, which automatically adjusts the light temperature and intensity according to the sun's natural rhythm and ambient light. It promotes wakefulness in the morning with cool light and stimulates relaxation in the evening with warm light, thus synchronizing with the natural biological rhythm. Thanks to its gradual and automatic adjustments, it improves well-being, visual comfort, and energy efficiency. It automatically deactivates during the "night" period, in playback mode, or when away.
-
Heating icon: it activates/deactivates heating automations.
-
Plug icon: allows you to activate/deactivate all configured plugs at once.
-
Store icon: it enables/disables store management automations.
-
-
Batteries: Displays the battery level of all battery-powered devices in the "living room". The tile changes color according to the level: green (OK), orange (< 50%), red (< 20%).
-
Sensors: Displays historical graphs (over 24 hours) for the sensors in the area (temperature, humidity, brightness, precipitation, etc.).
-
Security: Displays the status of security sensors (motion, occupancy, opening detectors).
-
Video surveillance: displays live feeds from cameras assigned to the "living room" area.
-
Shortcuts: visible if enabled in "display".
-
crossed-out eye icon: temporarily hides this "living room" area panel in the "home" section.
-
Gear icon: shows or hides the control panels specific to the "living room" area (described below).
-


Zone control panels (example: "living room")
These panels, accessible via the "gear" icon in the area, allow you to fine-tune all the automations in the "living room".
-
"Time" configuration
-
schedules: allows you to manually set the start times for the four periods of the day: day, dusk, night, and dawn.
-
Automates dawn, day and dusk: if this switch is activated, the system ignores manual times and automatically determines these periods (e.g., based on sunrise and sunset or light sensors).
-
-
"Lighting" configuration
-
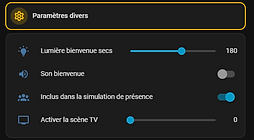
various parameters:
-
Welcome light seconds: duration (in seconds) for which the light remains on when you enter the area.
-
Welcome sound: Turns a welcome sound on or off (if a speaker is present).
-
included in the presence simulation: allows the lights in this area to be used by the presence simulation controller.
-
activate tv scene: defines which scene number should be activated when the television is turned on, the usual automations are then temporarily suspended.
-
-
Standard automations: switches to activate standard lighting (simple on/off) for each period (day, dusk, night, dawn).
-
Brightness in %: sliders to define the desired light intensity (from 0 to 100%) for each period.
-
advanced (enhanced) automation:
-
Day, dusk, night, dawn switches: if activated, the lighting will only turn on during these periods if a presence is detected.
-
include cameras / include door sensors: allows the use of camera motion detection or opening sensors as presence triggers for lighting.
-
-
colours: drop-down lists to choose a colour or temperature of white (e.g. "warm white", "red") for each period.
-
scenes: allows you to specify a scene number (1 to 4) to activate for each period, instead of a simple color or brightness.
-
Illumination levels in lx: brightness thresholds (in lux). Automatic lighting will only activate if the measured ambient light is lower than the value defined for the current period (day, dusk, etc.).
-
Delay in minutes: defines the time (in minutes) for which the light will remain on after the last motion detection.
-


-
"Heating" configuration
-
temperatures °c: sliders to define the target temperature for each period (day, dusk, night, dawn) as well as a specific temperature for the not-at-home mode.
-
use presence (enhanced): switches so that the heating only activates (for the periods day, dusk, night, dawn) if a presence is detected.
-
Delays in minutes: waiting time after departure (no one present) before turning off the heating.
-
-
"Shutters" (blinds) configuration
-
Standard automations: switches to activate blind management for each period.
-
position %: sliders (0-100%) to define the desired opening position for each period.
-
tilt %: sliders (0-100%) to define the tilt of the slats (for Venetian blinds) for each period.
-
advanced (enhanced) automations: switches to activate advanced modes for each period.
-
States (enhanced): Defines up to 4 behaviors based on brightness. For each state (1, 2, 3, 4), you set an illumination threshold in lux, a position percentage, and a tilt percentage. This allows, for example, closing the blinds to 50% if the sun is strong (e.g., > 30,000 lux), but reopening them to 80% if it is overcast (e.g., < 15,000 lux).
-
-
"Weather" configuration
-
weather: a simple switch to include in the weather data, allowing the sensors in this area (temperature, outdoor humidity) to contribute to the overall weather of the house.
-

-
"security" configuration
-
alarm system:
-
Use the sensors in the area: Includes the sensors in this area in the overall alarm system.
-
Weight: defines the importance (the "weight") of the sensors in this zone. A higher weight means that events in this zone contribute more to triggering the alarm (see "security" section).
-
flashing lights / sounding sound: if the alarm is triggered, the lights in this area will flash and the speakers will emit a sound.
-
-
cameras notification time: switches to allow notifications from cameras in this area for each period (day, dusk, night, dawn).
-
doors and windows:
-
check locks / close locks: activates automatic checking or closing of locks in the area.
-
Closing time / opening time: defines the times for these automatic actions.
-
check doors and windows / notify: activates alerts if doors or windows in the area are left open.
-
-
-
"cameras" configuration
-
This panel groups the configurations of each camera assigned to the area.
-
panel by camera (e.g., "video behind"):
-
Recording settings: set the offset (time before the start of the event), the duration, the frequency (0=never), the fixed recording time (00:00=never) and the anti-spam interval.
-
Manual prompt testing: button to test AI analytics.
-
uses ai manifest: enables AI image analysis for this camera.
-
instructions: free text field to give instructions to the AI (ex: "ignore cars, alert me if a package is visible").
-
Sensor 1 to 4: 4 blocks to define AI-based virtual sensors. For each one, you give a name, a question for the AI (e.g., "Is there a person?"), a sensor type (e.g., presence, opening) and a unit of measurement (optional).
-
-
When an event is detected on a camera, or when you have defined timing parameters, casasmooth automatically generates a prompt that incorporates all the questions you have defined. It sends this prompt to OpenAI and/or Gemini, retrieves the responses, and integrates them into a virtual sensor. These virtual sensors can then be used in any automation. Examples? You can determine, based on events or at a frequency you define, if:
-
whether the lid of a container is open or closed
-
if the car that just entered the yard is the postman's
-
if there are still parking spaces available in front of your house
-
if the dog is in its kennel
-
if the garden is covered in snow
-
etc, etc, etc...
-
-


"Security" section
This dashboard is dedicated to monitoring and managing the security of your home.
Main badges
-
Settings: Shows/hides the configuration options for this dashboard.
-
Away: Shortcut to global "Away" mode.
-
Armed: Main switch to manually arm or disarm the alarm system.
Control Panel (Visible if "Settings" is enabled)
Allows you to choose which panels to display in this section:
-
Titles / Subtitles
-
Configuration: Displays the basic alarm settings.
-
Planner: Displays the automatic arming/disarming planner.
-
FX cameras: Displays advanced camera functions (not detailed in the data).
-
Video cameras: Displays live feeds.
-
Locking / ... history: Displays the current status and history of the locks.
-
Opening / ... history: Displays the current status and history of the door/window sensors.
-
Presence / ... history: Displays the current status and history of occupancy sensors.
-
Motion / ... history: Displays the current status and history of motion sensors.
-
Leak: Displays water leak sensors.
-
Vibration: Displays vibration sensors.
-
Noise: Displays sound sensors.

"Security settings" panel
Since the settings are linked to a zone, see also the "zone" section.
This is the heart of the alarm system.
-
Arm security: Main switch (same as badge).
-
PIN: Field to define a PIN code (not used directly for arming/disarming in this interface, but potentially for future actions).
-
Events/min: (Read only) Displays the number of security events (movements, openings) detected in the last minute.
-
Events/min max: Triggering threshold. The alarm is triggered if the total "Weight" of events (defined in the configuration of each zone) exceeds this threshold in one minute.
-
Alarm activated: (Read only) Indicates whether the alarm is currently sounding.
-
Duration in mins: The length of time the siren will sound before stopping.
-
Send SMS...: Activates sending SMS alerts in case of alarm.
-
Message: The text of the SMS that will be sent (e.g., "SECURITY ALERT: Intrusion detected at home.").
-
Numbers...: The list of telephone numbers (separated by ";") that will receive the alert.
-
Test: A button to send a test SMS to the configured numbers.
"Planner" panel
Allows you to automatically arm and disarm the security system according to a schedule. For each day of the week (Monday to Sunday), you can set a "From" time (arming) and a "To" time (disarming).
Sensor panels (Cameras, Locking, Opening, Motion, etc.)
The rest of the "Security" section consists of panels listing all devices of a certain type, giving you a comprehensive overview of the house.
-
Video cameras: Displays all video feeds from all areas.
-
Locking / Opening / Presence / Movement / Leakage / Noise: Listens to all the tiles of the corresponding sensors.
-
... history: For each type of sensor, a "history" panel displays a graph showing the activity of the sensors over the last 24 hours.


"Heating" section
This dashboard centralizes the thermal management of your home.
Since the settings are linked to a zone, see also the "zone" section.
Main badges
-
Settings: Shows/hides the configuration options for this dashboard.
-
Away: Shortcut to "Away" mode (which activates the eco temperatures defined in "Home").
Control Panel (Visible if "Settings" is enabled)
-
Titles: Show/hide titles.
-
Scheduler: Displays the heating schedule settings.
-
HVAC / ... history: Displays thermostats and their history.
-
Radiator / ... history: Displays radiators/auxiliary heaters and their history.
-
Shutter / ... history: Displays the shutters (because they impact thermal performance) and their history.
-
Fan / ... history: Displays fans and their history.
-
Temperature / ... history: Displays all temperature sensors and their history.
-
Humidity / ... history: Displays all humidity sensors and their history.
"Planner" panel
Allows you to define, for each day of the week (Monday to Sunday), whether the heating automation should ignore the "Away" mode. Example: If you activate "Ignore Away Mode" on Saturday, the heating will remain in comfort mode that day, even if you have activated the overall "Away" mode.
Control panels and graphics
The rest of this dashboard groups devices and sensors by type for an overview:
-
HVAC: Displays the thermostatic maps of your heating/air conditioning devices (e.g., "climate.living room").
-
Radiator: Displays the switches for all your auxiliary heaters (e.g., "Heater stove", "Heater bath").
-
Shutter: Displays all your shutters (e.g., "Shutter blind").
-
Temperature: Displays the current temperature of all your sensors.
-
Humidity: Displays the humidity level of all your sensors.
-
... history: For each category above, a "history" panel displays the corresponding 24-hour graphs. The "Radiator history" panel includes a graph for the status (on/off) and another for the target temperatures.


"Air" Section
This dashboard is dedicated to monitoring indoor air quality (IAQ) and climate comfort.
Control Panel (Visible if "Settings" is enabled)
-
Allows you to show/hide Titles, Subtitles, Comments (text recommendations), Gauges (real-time), Indexes (index graphs) and Sensors (raw sensor graphs).
-
Allows you to show/hide the panel for each area individually (e.g. "Exterior", "Kitchen"...).
Area Signs (Example: "Office")
Each zone with compatible sensors has a dedicated panel.
-
Gauges:
-
Air Climate Index (ACI): A gauge from 0 to 100 that combines temperature and humidity to indicate a comfort index. (Green = Comfortable, Yellow = Average, Red = Uncomfortable).
-
Air Quality Index (AQI): A gauge from 0 to 500 that measures air quality based on pollutants (CO2, PM2.5 particles, VOCs, etc.). (Green = Good, Yellow/Orange = Moderate, Red/Purple = Bad/Dangerous).
-
-
Index (Graphics): Displays the 24-hour history of both ACI and AQI indices.
-
Comments:
-
ACI: Displays dynamic text giving you recommendations based on the comfort index (e.g., "Air quality - Moderate. It is advisable to increase ventilation...").
-
AQI: Displays dynamic text based on the air quality index (e.g., "Air Quality - Poor for sensitive groups...").
-
-
Sensors (Graphics):
-
Displays historical graphs (24h) of all raw sensors that contribute to the indices (Temperature, Humidity, CO2, PM1, PM2.5, PM4, PM10, VOC, NOx, etc.).
-
(Note: Areas without air quality sensors will display a message "No usable sensor in [Zone]")

"Energy" Section
This dashboard is your command center for managing energy production, consumption and costs.
Main Badges
-
Settings: Shows/hides the configuration options for this dashboard.
-
Away: Shortcut to global "Away" mode.
Control Panel (Visible if "Settings" is enabled)
Allows you to choose which panels to display in this section, providing a very granular view:
-
Titles / Subtitles
-
Overview: Real-time overview.
-
Date Selection: The standard period selector.
-
Distribution: The energy flow diagram.
-
Source table: Table breaking down the flows (network, solar, battery).
-
Indicators: Performance gauges (self-sufficiency, etc.).
-
Devices: Consumption graphs by device.
-
Details: Overall usage and solar production graphs.
-
Exchanges / Sources / Proportions / Historical sources / Total consumption / Sources - consumers / Consumers / Daily consumption / Historical consumers / Forecast: Different graphical and analytical views of your energy data.
"Energy Overview" panel
A summary of your home's energy status.
-
Real-time power flow: 4 tiles showing solar production, battery level, exchange with the grid (positive if you buy, negative if you sell), and total consumption of the house.
-
Charts and Gauges:
-
Energy Sources Today: A donut chart showing the share of your consumption coming from solar, battery, and the grid.
-
Self-sufficiency (Today / Now): Two gauges showing your level of independence from the network over the day and at time T.
-
-
Daily indicators:
-
Today's Cost: The total cost of energy consumed since midnight.
-
Today's Usage: The total amount of energy (kWh) consumed since midnight.
-
Solar production: The total energy (kWh) produced by your panels today.
-
Avg kwh price: The weighted average price of your energy, taking into account the solar/battery/grid mix.
-
-
Power Trends - 24h: A graph superimposing consumption, solar production, battery usage and exchange with the grid over the last 24 hours.
-
Status and alerts: Tiles whose color changes depending on the status:
-
Current consumption: Turns red when consumption is high.
-
Battery status: Changes color (green, orange, red) depending on the charge level.
-
Network Exchange: Changes color and icon if you are importing (orange/red) or exporting (green) energy.
-


"Date Selection" panel
Allows you to choose the period (day, week, month, year) for the historical analysis panels.
"Distribution" sign
Displays the energy flow diagram (similar to the one in the "Overview" panel).
"Proportions" panel
Displays three donut charts comparing the "Solar + Battery" vs. "Grid" share for Today, This Month, and This Year.
"Figures" panel
Displays a detailed table (provided by Home Assistant) breaking down energy flows between all sources and destinations.
"Indicators" panel
Four performance gauges for the selected period:
-
Grid Neutrality: Indicates whether you have injected more energy than you have consumed.
-
Solar consumed: Portion of your solar production that you have consumed directly.
-
Fossil source: (Information dependent on an external source) Share of your consumption coming from fossil sources.
-
Self-efficiency: Overall self-sufficiency rate (solar + battery).
"Devices" panel
Displays the consumption of each individual device in graphs ("Global" and "Detailed").
"Details" panel
-
Energy use: Graph of total home consumption.
-
Solar production: Solar production graph.
"Exchanges" sign
Displays tiles and a graph of exchanges with the network (import, export, and export value).
"Sources" panel
Displays tiles for each energy source (PV, Battery status, Battery usage, Grid) with a "graph" button to show/hide the 24h history of this source.
"Sources - consumers" panel
Displays a Sankey diagram (flow) showing the distribution of energy from sources (Photovoltaic, Battery, Grid) to the "Home", then its breakdown to each consuming device (Heating, IT, Chargers, EV, Boiler, and "Unmetered").


"Consumers" sign
This is the most powerful control panel for energy management. It lists each device whose consumption is monitored (e.g.: "voltcraft_power", "heating_power_2", "ev", "boiler"...).
For each device in the list, you have the following controls:
-
Status Tile: Displays current consumption in real time.
-
Control grid (4 buttons):
-
Switch (On/Off): Allows you to manually force the device to turn on or off.
-
Automation (robot icon): Enables or disables automatic management of this device by casasmooth.
-
Graph (graph icon): Shows/hides a graph of 48-hour consumption history.
-
Settings (gear icon): Shows/hides the advanced settings panel below.
-
When you activate the Configuration for a device (e.g. the "boiler"), the following panels appear:
-
History: A graph showing the desired state (requested by the automation) over time.
-
"Active" panel:
-
Sets the conditions for turning on the device.
-
Only when at home: The device will only turn on automatically if "Away" mode is not activated.
-
Solar above: (Cursor) The device will only turn on if the solar production exceeds this value (in W).
-
Battery Exceeds: (Slider) The device will only turn on if the battery level exceeds this percentage.
-
Before Solar Peak: (Slider) Allows you to force ignition X minutes before the expected solar peak time (useful for preheating).
-
Turn on at this time: Fixed time to force turn on (if set to 00:00, ignored).
-
Notify above: Sends you an alert if the device's consumption exceeds this threshold.
-
Session Management: (Switch) Indicates whether this device operates by "session" (like a washing machine, which must complete its cycle).
-
Energy category: Allows you to classify the device (e.g.: Heating, EV, Household appliances).
-
-
"Disabled" panel:
-
Sets the conditions for turning off the device.
-
Don't interrupt if more than: (Slider) If the device consumes more than this value, the automation will not turn it off, assuming it is in full cycle (useful for "Session Management").
-
Solar Below: (Slider) Turns off the device if solar production falls below this value.
-
Battery Below: (Slider) Turns off the device if the battery drops below this percentage.
-
After Solar Peak: (Slider) Forces shutdown X minutes after the predicted solar peak time.
-
Grace Period: (Slider) Duration (in minutes) the device will remain on even if the conditions (solar, battery) are no longer met, to avoid constant shutdowns/restarts.
-
Turn off at this time: Fixed time to force shutdown (if set to 00:00, ignored).
-
Notify under: Sends you an alert if consumption falls below this threshold (e.g. to signal the end of a cycle).
-
Concrete example: You can set your boiler to turn on automatically (robot activated) only when you are at home, the sun is producing more than 2000W and the battery is at more than 80%. You can set a grace period of 15 minutes. If a cloud passes and the solar drops to 1500W, the boiler will stay on for another 15 minutes, waiting for the sun to return, before turning off to preserve the battery.


Consumer-focused management
A special feature is available in your casasmooth system: the ability to make any consumer, as we have just seen, controllable.
This means you can make a plug very smart — for example, an electric vehicle charger, a bike plug, etc.
How does it work?
-
First, enable session management in this panel.
-
casasmooth then generates a QR code for each consumer. This QR code can be affixed to your EV charger.
-
By default, your charger is disabled, which prevents any power consumption without prior authorization.
For the user:
-
He scans the QR code: a page opens allowing him to enter his email address and the desired amount of energy.
-
He receives an email a few seconds later to confirm his purchase and validate his email address.
-
The socket is then unlocked for the duration or amount of charge planned.
-
Once the session is over, the socket locks automatically.
-
The user receives a summary email with the amount to pay.
Analysis panels (Consumption, History, Forecast)
Daily Consumption: A stacked bar chart showing, hour by hour, the consumption of each device, helping you identify consumption peaks.
Historical consumption: A line graph superimposing the consumption of all your devices over 48 hours.
Forecast: Displays solar production forecasts (if available): peak power today, production for the next hour, remaining today, total today, and total for tomorrow.


"EV car" section
This section is dedicated to managing your electric vehicle.
badge: "settings".
Control Panel: Allows you to show/hide the "Overview", "Costs", "Detailed Breakdown", "Safety", "Climate", "Controls", "Status", "Other/Info", and "Charging" panels.
"vehicle status" sign (preview)
Displays real-time status: battery level, range (autonomy), charging power, odometer, remaining charging time, target charge level, and last update.
Includes a 24-hour charging power graph.
"energy and ve costs" panel
Displays current rate (price/kwh), daily total, monthly total and annual total charging costs.
“detailed distribution” panel (economic logic)
This section distinguishes the charging costs.
external rate / external daily / external monthly: tracks the costs of charging outside the home (public terminals), using an average price defined in the settings.
Average daily/monthly rate: calculates the actual average cost of your recharges, taking into account the energy mix (solar, battery, network) used at home and external costs.
vehicle control panels
Displays tiles and graphics to interact with the vehicle (options depend on the model):
safety: condition of the doors.
climate: air conditioning control, seat heating.
controls: management of departure timers.
Status: Battery graphs, odometer, range, update time.
other/info: days before next inspection.
charging: charge switch, target level setting, battery care mode.


"Health" section
This section groups together health and activity data from your connected devices (watches, phones).
-
badge: "settings".
-
Control Panel: Allows you to show/hide the "Activity", "Vital Signs", "Summary" panels and the panels for each device/person.
-
panel per device
-
Activity: Displays graphs and tiles for steps, active calories, distance, and elevation.
-
Vital Signs: Displays graphs for heart rate, heart rate variability (HRV), VO2 max, and blood pressure (systolic/diastolic).
-

"Household appliances" section
Consolidates control of your smart home appliances.
-
badge: "settings".
-
control panel: allows you to show/hide the categories "cooking", "storing", "cleaning".
-
“cooking” panel: displays controls for:
-
stove: switch, temperature.
-
oven: switch, door status, end time, progress, temperature.
-
microwave: switch, door status, power.
-
venthood: switch, speed.
-
coffee machine: switch, water level, temperature.
-
-
“storing” panel:
-
refrigerator: switch, door status, temperature.
-
freezer: switch, door status, temperature.
-
-
“cleaning” sign:
-
dishwasher, washer, dryer: each with switch, door status, end time, progress.
-

Weather section
A detailed and historical view of the weather.
-
badge: "settings".
-
control panel: allows you to show/hide the "real time", "history", "reduced", "synthetic", "general" panels.
-
“Real-time” panel: displays the current values of all your weather sensors (temperature, humidity, brightness, wind, gusts, pressure, precipitation).
-
“history” panel: displays a grid of graphs (over 24 hours) for each of the sensors above.
-
“synthetic” panel: displays the complete weather map with forecasts.
-
"General" panel: displays integrated weather maps (windy.com) showing wind, temperature and pressure over Europe.


"Media" section
Centralize control of all your media players and televisions.
-
badge: "settings".
-
Control Panel: Show/hide "All Sonos Players", "Media Players", "Televisions".
-
"All Sonos Players" panel: (displays a "No Sonos system" message if not applicable).
-
“media players” panel:
-
play on all players: one switch to sync playback across all devices.
-
List of all control cards for your speakers (e.g. "salon display", "bose 30", "pc", "manger speaker", etc.).
-
-
“televisions” panel: list of control cards for your televisions (e.g. “attic”, “google tv streamer”).

"Overview" section
This dashboard is designed for quick action, grouping all devices of the same type, across all zones.
Control Panel (Visible if "Settings" is enabled)
Allows you to show/hide Titles, Subtitles, and the categories Lights, Outlets, Consumers (outlets with metering), Store (shutters), and Motion.
"Lights" sign
-
Shortcuts: "On" and "Off" buttons to control all the lights in your house with just one click.
-
Lists by Zone: Then displays, zone by zone (Exterior, Kitchen, Living Room, etc.), the list of all lighting tiles for individual control.
"Consumers" sign
Displays a grid of all your metered outlets (e.g. "voltcraft_outlet_1", "ev", "boiler") with a simple on/off switch for each.
"Store" sign
Displays a grid of all your shutters and blinds (e.g. "store_volet").
"Movement" sign
Displays a grid of all your motion sensors, allowing you to quickly see where activity is detected.

"Monitor" section
This section turns any sensor into a smart monitoring tool with custom alerts.
-
Monitoring logic: For each sensor (power consumption, door opening, temperature, etc.), you can create a monitoring rule.
-
Concrete scenarios:
-
Washing Machine: Create a monitoring feature for the washing machine's outlet. Set a notification to alert you when its power consumption drops below 5W for more than 2 minutes, signaling the end of the cycle.
-
Freezer: Monitor the freezer temperature sensor and receive an alert if the temperature exceeds -15°C for more than 10 minutes.
-
Front Door: Be notified if the front door is left open for more than 5 minutes.
-

"Systems" section
This dashboard is intended for maintaining and monitoring the health of your casasmooth system and devices.
Control Panel (Visible if "Settings" is enabled)
Allows you to show/hide Titles, Subtitles, System Indicators, Software Update, WOL (Wake-On-Lan) Devices, Batteries, Device Update, and Entities by Units.
"System Indicators" panel
Displays your machine's resources: CPU usage (%), CPU temperature, RAM used (MB and %), Disk space used (GB and %).
"Software" panel
Displays update status for Home Assistant components (OS, Core, Supervisor) and a "Reboot after update" switch to automate post-update reboot.
"Wake-up on LAN" (WOL) panel
Displays buttons to "wake up" (remotely turn on) devices on your network (e.g., a desktop computer) by sending a "magic packet" to their MAC address.
"Battery Status" Panel
Lists all battery-powered devices in your home (over 40 in your setup).
-
Display: Each device is a tile.
-
Color: The background color indicates the status (Green/Orange/Red/Gray).
-
Action: Clicking on a tile opens a pre-populated Google search telling you the exact procedure to replace the batteries in that specific device (e.g., "Battery replacement procedure for a Netatmo Smart Outdoor Module device").
"Update device" panel
Lists all devices (more than 60) for which a firmware update is available or which are managed by the system.
-
Display: Each device is a tile.
-
Color: Color indicates status (Blue = Update Available, Green = Up to Date, Orange/Yellow = Unavailable/Unknown, Red = Error).
-
Action: As with batteries, clicking on a tile opens a Google search for the firmware update procedure for that device.

"Administration" section
This dashboard is the high-level configuration center for casasmooth.
Control Panel (Visible if "Settings" is enabled)
Allows you to show/hide Titles, Welcome, Status, Notifications, Settings (Global), Energy Costs, and API panels.
"Welcome" sign
Contains the same information as the "Welcome" panel in Home, with fields (Email, Mobile), buttons (Backup, Services, Update), and additional fields:
-
Base URL...: The web address of your casasmooth instance.
-
API Token: Your authentication token for external services.
"Status" panel
Displays your system version information, timestamps of the last operations (update, backup, log rotation, reboot), and your unique identifier (GUID).
"Notifications" panel
Allows you to choose the channels through which you wish to receive alerts.
-
System notifications: Main switch.
-
App Notifications: Push notifications to your phone.
-
Persistent notifications: Alerts visible in the casasmooth web interface.
-
Notifications to my email: Send alerts to your email.
-
SMS Notifications: Sending SMS messages (mainly for security).
-
Voice notifications: Announcements on home speakers.
-
Test: Button to send a test notification on all enabled channels.
"Settings" panel
Defines global monitoring rules.
-
Battery/Firmware Check: Enables the automatic checks that populate the "System" dashboard.
-
Freezer/Rain/Wind Checks: Activates specific monitoring (e.g. alert if the freezer is too hot, or if a window is open when it is raining).
-
Lights off after delay (h): A global security to turn off all lights in the house if they have been on for a set number of hours (e.g. 4 hours), in case an automation has failed.
"Energy Costs" Panel
Allows you to define your basic energy costs (used for all economic calculations).
-
Home energy cost: Cost of household energy (general).
-
Charger energy cost: Specific cost for chargers (e.g. public EV chargers).
-
Battery energy cost: Depreciation cost of your battery per kWh.
-
Grid energy cost: Price of purchasing energy from the grid.
-
Network energy price: (Seems redundant with the previous one, may be a resale price).
-
Reset energy sensors: Button to reset the energy meters.
-
Last energy reset: (Read only) Displays the date of the last reset.
"API" panel
Provides a link to download the casasmooth API technical documentation and displays the date this documentation was last updated.


"Users" section
Easily manage access for your guests, tenants or service providers.
Access slots
-
Set up to 5 simultaneous time slots
-
Please provide the email address, PIN code, and start/end dates.
Automatic notification
casasmooth automatically sends an email to users to confirm their arrival and departure times, as well as the access code to your accommodation.
QR Code Access
Important: Access to casasmooth for your guests requires a connection to your private Wi-Fi network. Remember to share the network name and password with them. A personalized QR code for your property is generated by casasmooth and available in the Media section. Print it and place it near your front door: your guests can scan this code to access a simplified casasmooth interface, allowing them to control the locks and lights.
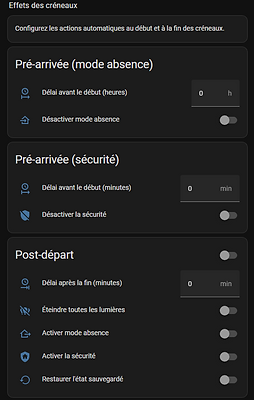
Intelligent automation
-
Before arrival: automatic deactivation of absence mode and security
-
After departure: turn off the lights, reactivate absence mode and security. And, very importantly: restore casasmooth to its default state in case a guest has changed any other settings.
Customizable deadlines
-
Pre-arrival delay: 0-24 hours (away mode) and 0-120 minutes (security mode)
-
Post-departure delay: 0-120 minutes
Expired slots are automatically cleared after 24 hours.

Technique and comments
casasmooth is a robust platform, designed in Switzerland, which combines performance and respect for privacy.
-
Technologies: The system relies on standard and open technologies , allowing it to interface with a wide range of devices (Zigbee, Z-Wave, Matter, Wifi, Bluetooth) from different manufacturers.
-
Openness: While casasmooth offers a "ready-to-use" experience, its platform remains open, allowing you to add your own devices or customize the logic if you wish.
-
Security and Privacy: At the heart of casasmooth's philosophy is that your data belongs to you. By operating locally ("local-first"), your system doesn't expose your lifestyle habits to third-party servers. External access is end-to-end encrypted, and optional services like backup are subject to strict Swiss security standards.